Introduction
I have always found it fascinating how the English language is built up and whether aspects within writing have an effect other parts text. Using Bivariate data analysis, I hope to use statistics to highlight the connections in English writing.
In this investigation I will be analysing any correlation between the average lengths of words and sentences within articles from newspaper articles written by reporters working in The Independent newspaper. It is an intriguing theory that I would really like to prove or disprove: do longer sentences mean that people use longer words; if so, is there a strong correlation? If there is a negative correlation, does it indicate that the writer has to use a large number of small words to get the same point across, as fewer longer words?
Data Collection
The collection of the data needed for this investigation took place utilising The Independent newspaper website. The first three headlines under UK News and World News were taken for analysis. As I wanted to balance out the types of articles, I endeavoured to analyse articles taken from different topical areas, such as transport, health and politics, if the headlines were biased to a certain subject area. The parent population of the data would be all news articles published online by the paper from October and November. From the data collected half, comes from weekday editions and the remainder is taken from weekend news from the site. This process of sampling should represent the parent population and can be treated as an acceptable random sampling process.
The Independent newspaper was chosen, due to its ease of data collection from their well laid-out site and for a consistent style of reporting. Unlike other newspapers, the Independent relies heavily on their own reporters rather than secondary sources. This will certainly help to show if a correlation exists within the same style of writing. If a range of newspapers were used it would be much less likely to show a correlation because writing styles do change from paper to paper. I know this for a fact, because I analysed data from 60 articles taken from tabloid and broadsheet newspapers. The correlation was very close to zero, the scatter chart showed no apparent line of best fit. The data source was the same as that of a previous coursework looking at newspaper readability (see: Newspaper Readability) another example of my statistical research into newspaper article prose.
The sole reason for using the internet is to save an inordinate amount of time copying prose from the real Independent newspaper or the hassle and inaccuracy of OCR (optical character recognition) using a scanner. On the internet it is relatively easy to find articles in well-known newspaper web sites, and it is quite a simple process of copying, organising and processing the texts to give a list of statistics. I used Internet Explorer 5 to browse the web for the sample and Word 2000 produced an array of statistics on each of the articles. Sources are listed in the appendix. Rounding errors will not occur as Excel 2000 will refer to original data for each calculation. Numbers printed in this investigation will be rounded to 4 s.f.
Assumptions
The length of sentences and words can be considered as having random values. For any article in the newspaper that is read, it is quite difficult to give any reasonable average word or sentence length at a glance. There will not be any obvious link between the two variables from the careful study of a few articles, therefore I will study this is more depth, using a larger sample of 50 or more articles taken using a process which should be both random and representative of the parent population of the English newspaper articles as a whole. In the hope of using a representative sample: headings, dates, names of reporters and listed points will be omitted from the data analysis. This would have effected the sample by producing an unfair bias to longer words and short sentences.
The date of acquiring data should have not have a negative effect on the data, it should continue to be equally representative of the parent population. Spelling of words will be data sample, mainly due to the problem of recognising uncommon names and terminology specific to a certain situation.
I am conscious that incorrect spelling will have an effect on the data, joining of words appears to be worryingly consistent in some newspapers. Typos (typing errors) are certainly inevitable and are a familiar part of newspapers, therefore I can consider them as a valid part of the sample. However, I wish they checked their spelling before sending to press!
Variables
I have chosen the mean characters per word as the X-axis. I feel the mean word length is easier to calculate than the sentence length, making possible predictions of the sentence length easier to obtain. In addition, from looking at the source data, the range of values for word length appear to be proportionally smaller and values more consistent than sentence length. Therefore the following can be stated:
X = Mean word length throughout text
Y = Mean sentence length throughout text
The sample data is listed in ascending order of X, to highlight any correlations that may lie within X and Y values. Characters per word and words per sentences are used throughout.
Data
n Article Name Mean Length of
X2 Y2 XY Words X Sentences Y 3
Riots Rage In Hebron After...
4.02
17.6
16.1604
309.76
70.752
1
Paddington Train Disaster: ‘I...
4.19
17.3
17.5561
299.29
72.487
2
Big Apple’s Art Crown Shaken
4.23
17.5
17.8929
306.25
74.025
4
Indian Villagers Boycott Election
4.29
18.6
18.4041
345.96
79.794
5
Forty Refugees Massacred By...
4.33
18.5
18.7489
342.25
80.105
6
Paddington Train Disaster:...
4.34
18
18.8356
324
78.12
7
Six Confirmed Dead In Austrian...
4.41
21.1
19.4481
445.21
93.051
8
Mullahs Try To Silence Khatami's...
4.5
18.3
20.25
334.89
82.35
9
Spanish Hold Vigils Urging Eta...
4.59
18.2
21.0681
331.24
83.538
10
East Timor: Un Forces Swoop On...
4.66
18.6
21.7156
345.96
86.676
11
Hague Lets Tory Back Gay Rights...
4.69
22.6
21.9961
510.76
105.994
12
The Battle Is Won, But The War...
4.71
18.9
22.1841
357.21
89.019
13
Straw Sends All British Judges...
4.71
20
22.1841
400
94.2
14
Arts May Reap Millions In...
4.76
22.2
22.6576
492.84
105.672
15
Three Crushed To Death After...
4.79
23
22.9441
529
110.17
16
Revealed: What Made Dobson..
4.82
21.8
23.2324
475.24
105.076
17
Crackdown On Doctors Leaving...
4.83
22.6
23.3289
510.76
109.158
18
Van Gogh's Little Brother Goes...
4.86
23.6
23.6196
556.96
114.696
19
The Gay Community Counts The...
4.96
23.1
24.6016
533.61
114.576
20
French Ban On British Beef...
4.96
23.7
24.6016
561.69
117.552
21
Revealed: John Major Has Second...
4.98
23.4
24.8004
547.56
116.532
22
Un Hosts Talks On Cyprus...
5
24.1
25
580.81
120.5
23
Bergen Junior Tries To Keep...
5.02
24
25.2004
576
120.48
24
Personality Tests May Be Used...
5.07
24.8
25.7049
615.04
125.736
25
President's Assurance Of A Fair...
5.1
23
26.01
529
117.3
26
Fashion Young Guns Find Glory...
5.16
23.6
26.6256
556.96
121.776
27
Woodhead Must Go, Says Blair
5.18
25
26.8324
625
129.5
28
Incompetent' Us Condemned...
5.19
24.1
26.9361
580.81
125.079
29
Victory For UK: Beef Gets Clean...
5.19
26.2
26.9361
686.44
135.978
30
Wahid's Threat To Australia's...
5.21
23.6
27.1441
556.96
122.956
31
Logjam Leaves Students Waiting...
5.22
24.5
27.2484
600.25
127.89
32
Blair Pledges To Purge Britain Of...
5.22
25.1
27.2484
630.01
131.022
33
Railtrack To Be Stripped Of...
5.27
25
27.7729
625
131.75
34
Alcopop On Sale Next To Sweets
5.27
26.1
27.7729
681.21
137.547
35
Black Box Reveals Safety Failures...
5.27
26.4
27.7729
696.96
139.128
36
Tory Party Conference: Tories...
5.29
25.4
27.9841
645.16
134.366
37
Paddington Train Disaster: Human...
5.3
25.6
28.09
655.36
135.68
38
‘Sensation’ War Hots Up As...
5.3
27
28.09
729
143.1
39
Billionaire Who Blew Whistle On...
5.34
26.5
28.5156
702.25
141.51
40
Babies' Bodies 'Looted' Without...
5.35
29.5
28.6225
870.25
157.825
41
Tory Party Conference: Tories...
5.37
25.4
28.8369
645.16
136.398
42
Ian Brady Force Fed In Secure...
5.37
26.7
28.8369
712.89
143.379
43
Smith Insists On Outside Inquiry...
5.4
26.7
29.16
712.89
144.18
44
France's Apple Growers Shaken...
5.41
25.8
29.2681
665.64
139.578
45
The General's Favourite Swag...
5.41
26.5
29.2681
702.25
143.365
46
Genetic Crops May Be Banned
5.41
28.6
29.2681
817.96
154.726
47
China Selects The Blair That's...
5.42
28.1
29.3764
789.61
152.302
48
Scientists Use Mice To Incubate...
5.44
26.1
29.5936
681.21
141.984
49
Labour Party Conference: Wax...
5.49
30.7
30.1401
942.49
168.543
50
Chile's Future Hangs On The...
5.51
26.6
30.3601
707.56
146.566
51
Five Judges Are Reprimanded For...
5.54
30.5
30.6916
930.25
168.97
52
Bloody Sunday Troops Want To...
5.55
27.9
30.8025
778.41
154.845
53
Blair Says Livingstone Is Backed...
5.58
27
31.1364
729
150.66
54
Expert On Gm Danger Vindicated
5.6
28.8
31.36
829.44
161.28
55
Peace In Middle East Is One Step...
5.61
31.2
31.4721
973.44
175.032
56
Workaholic Boss Forced To Take...
5.66
34
32.0356
1156
192.44
57
Government's Planned Ban On...
5.7
31.3
32.49
979.69
178.41
58
Bored 14-Year-Olds Should...
5.8
28.5
33.64
812.25
165.3
n=58
S=
294.85
1418.5
1713.35
35569.05
7300.624
Mean Values
The mean of the values taken from the table can be used to draw a line of best fit on a scatter diagram. The mean values of X and Y are as follows:
X = = 5.084
Y = = 24.46
Scatter Diagram
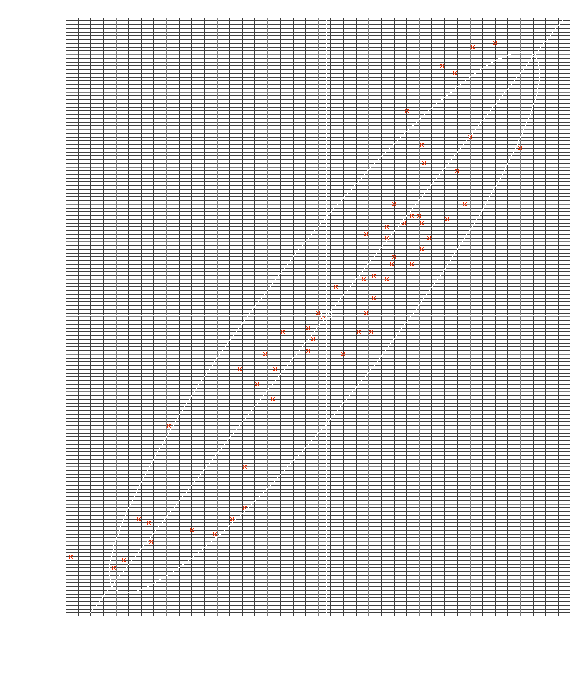
From the spread of the data in the scatter diagram, there appears to be a positive correlation with variables X and Y increasing in concurrence. The distribution of the data is elliptical, shown by the ellipse superimposed on the spread of the greater part of the data. Many of the points lie close to the line of best fit and within the narrow ellipse, indicating a positive correlation between X and Y. In positive sectors (top right; bottom left of mean centre) there is a total of 54 data points, while there are only 4 data points in the negative sectors (top left, bottom right of mean centre), this indicates a good positive correlation.
Normal Distribution
To show data values follow a distribution, the data for the variables X and Y will be independently plotted against a normal distribution curve.
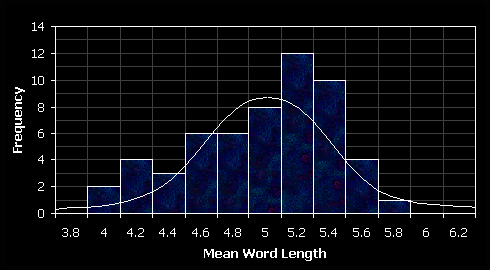
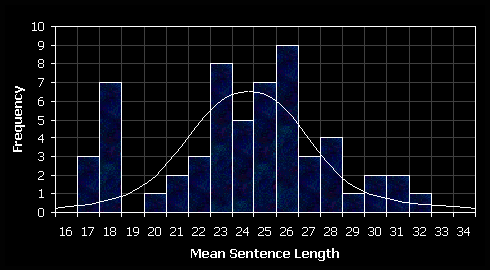
The variables of X and Y both can be approximated to a normal distribution curve. The mean word length distribution is slighted negatively skewed and the mean sentence length appears to be bimodal, with no values equalling 19. In the context of mean sentence length this can be regarded at as quirk in the results, despite the large sample set (unless, for some reason, reporters purposely avoid this number!). Mean word and sentence length are independent random variables – simply replacing short words with long words in a sentence doesn’t make a sentence longer. Both data sets follow a normal distribution curve and the scatter diagram shows the data points can be represented using a line of best fit, therefore the Pearson’s Product Moment correlation coefficient method can be used to show any correlations.
Correlation Coefficient
The Pearson’s Product Moment correlation coefficient can be calculated using the covariance of X and Y.
Mean X =
=
=
Standard Deviation X = SX =
=
Mean Y =
=
=
Standard Deviation Y = SY =
=
Covariance = SXY =
=
7289.3 – 5.084 × 24.42 = 1.5234
Correlation Coefficient = r =
=
= 0.9362
As the correlation coefficient is close the 1, the correlation is strong between X and Y independent random variables.
Hypothesis Testing
To test if there is a significant correlation in the representative sample data, I will perform a hypothesis test on the Product Moment Coefficient, r. The hypothesis are as follows:
H0 Null Hypothesis: p = 0 If significant, there no positive correlation present between variables X and Y.
H1 Alternative Hypothesis: p > 0 If significant, there is a positive correlation between random variables X and Y.
On consultation of the tables, the critical value a single tailed test at 2.5% significance, where n = 58, the critical value p = 0.2589. As r: 0.9362 > 0.2589, H0 is rejected. The difference between the critical value and the correlation coefficient is great, this indicates a very strong correlation between the two data samples.
As the alternative hypothesis (H1) is accepted, my premise is correct. As strong correlation can be found between word and sentence length for news articles in the Independent newspaper. I am confident that these correlations lie with other newspapers and in other media such as in magazines, novels, websites and students’ coursework. However, data analysis taken from a larger population indicates that varying styles of writing have an effect on the correlation correlation.
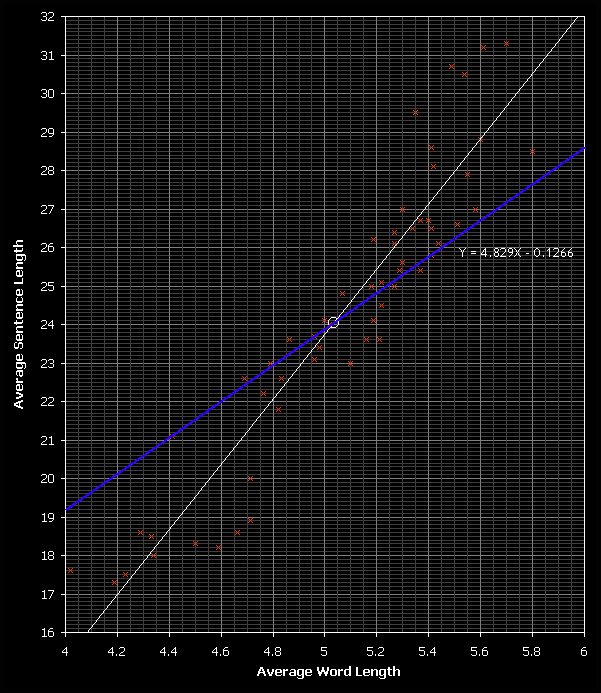
Line of Regression
The line of regression will show differences between the two linear functions used to conjecture data values from another. The sum of squares of X = S X2 = 1509.5 and as the covariance was found as: 1.5234, the following equation can be used to calculate the line of regress in terms of X.
=
Y – 24.42 =
(X – 5.084)
Y = 4.829X – 0.1266
The histogram shows the line of best fit and the line of regression is shown in blue. The equation of the line of regress is: Y = 4.829X – 0.1266. It cuts through the mean at (5.084, 24.46), visible from (19.189, 4) to (28.847, 6). The line of regression crosses the X-axis at -0.1266 and the . The line of regression crosses the X-axis at and the Y-axis at -0.1266.
The line of regression can now be used to estimate a value for X or Y given that the other value is already known. As there is a good correlation it can should give an easier alternative if words or characters were being counted manually.
In my keenness for retrieving and processing articles from the Independent website, I over estimated the amount of data that I needed. A recent article omitted from the same was titled: "French Small Farmers Head For Extinction", the mean characters per word is: 5.12. Using the line of regression: 4.829(5.12) – 0.1266 = 24.6. Percentage error = (100 × 0.1) ÷ 24.7 = 0.4% error. This error is surprisingly small showing a good representation of the scatter diagram data points.
Conclusions
In terms of headline news from the online Independent newspaper, there are several connections between the manner in which prose are written. The implementations of correlations with in the sentence and word structure could indicate on the training reporters need in order to report for the newspaper, or a consistent editorial team. This investigation has shown a clear pattern in an organisations writing style, possibly caused by the influences people have on each other within the newspaper offices. It might even be possible to calculate lines of regressions for word and sentence length of other newspapers. It would be a useful guide to identifying torn-off articles. Similar processes have been used in the past, notably on the works of Shakespeare to find out if he actually wrote everything under his name. Even if statistics are drawn up on sentence structure, there is not enough evidence here to show that correlations equally apply to other organisations or individual writers.
A possible reason for why both variables increase together could be confidence of a writer or the audience to which the article is aimed at.
The relationship between the length of words and sentences has been established within a certain writing style. If a reporter wishes to produce an article which is quick and easy to read information, the sentence and word length will be shorter. Placing full stops at regular intervals quickens the pace of the article, making it appear as if the reader was seeing events happen through their own eyes. A accurate example of this would be "Paddington Train Disaster: ‘I Can See Her Trapped, Her Face Behind Glass, Crying For Help. I Don't Think She Made It’". This article was dialogue heavy account of the disaster, in which a survivor of the crash was speaking of her experiences. The reporter took the opportunity to produce a fast paced article, hopefully making it possible for readers to understand the situation better.
An example of very much slower paced article, where long words and sentences were used, would be: "Workaholic Boss Forced To Take A Holiday Died Saving His Wife In Tour Death Crash". This is another sad story looking at a bitter-ironic tale of an over worked man going on holiday; dying whilst attempting to save his wife. At a glance, the article contains more long adjectives and pronouns than previously.
Evaluation
As with all sampling methods, inconsistencies and errors are almost guaranteed to give inaccuracies within the data. I feel the choice of newspaper was sufficient in comparison with inconsistence newspaper websites like the Guardian and The Times, both which are related to other newspapers (Observer and Sun respectively). In addition the Independent is one of the few newspapers that is not politically biased. The online version of the newspaper is quite likely to be edited earlier than articles for the paper version. This is due to the nature of the web – post the news quickly, otherwise people will read elsewhere. Its could almost be compared to a text version of the news on television. In most instances, editors have time to check over articles before they are sent to press. The paper version is also more final than the web, if a mistake is made once the printing has started there is no way to change it. Some people also rate the web less highly than the traditional paper version, this could all mean a misrepresentation of the newspapers style.
Copying of data from the browser to Word might have resulted in errors. It is possible that some articles were not completely copied. The grammar check process might have miscalculated words if they were incorrectly spelt. This would also lead to inaccuracies.
In order to further improve relevance with the parent population I could investigate all articles written by the Independent newspaper, within a set time scale [of a week]. To expand this investigation and include comparisons between other newspapers it would be sensible to increase the parent population to incorporate other newspapers, with different writing styles. Perhaps it would also be interesting to study articles, organised by subject matter rather than source. This would encompass more texts and could help further improve whether there is a certain style specific to a type of profession.
Appendix
Microsoft Word 2000 ... Document typed using this program
Microsoft Excel 2000 ... For all tables, calculations and charts
The Independent Newspaper Website ... Source for data (visit: www.independent.co.uk)Main Formulae used in Excel 2000:
SX
= 0.4305961
= STDEV(C3:C60)
SY
= 3.8450261
= STDEV(D3:D60)
SXY
= 1.5233671
= COVAR(C3:C60,D3:D60)
r
= 0.9362425
= PEARSON(C3:C60,D3:D60)
SX2
= 1509.4741
= SUMSQ(C3:C60)
SY2
= 35436.05
= SUMSQ(D3:D60)
Feedback